|
|
|||||||||||||||||||||||||||||||
|
Hot Hot Hot 2005: The Hottest Year in Canadian HistoryNOTE - The article below was written in 2006 and later updated in 2008. There has been even hotter years since then.
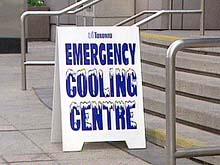
Based on estimates by NASA's Goddard Institute for Space Studies, 2005 was the warmest year since reliable, widespread instrumental measurements became available in the late 1800s, exceeding the previous record set in 1998 by a few hundredths of a degree. Estimates prepared by the World Meteorological Organization and the Climatic Research Unit concluded that 2005 was the second warmest year, behind 1998. Temperatures in 1998 were unusually warm because the strongest El Nińo in the past century occurred during that year. Regardless of wherever you go in the world, even to the Antartica, this has been an extremely hot year. In fact, its the hottest year ever recorded according to scientists. 2005 broke records dating back to the Great Depression when record heat caused the "Dustbowl Effect" that turned large amounts of the United States into desert (which took decades to heal). Indeed, if the current draught and heat-wave that is effecting Canada, the United States, China, Africa and Australia continues, we will eventually end up with a lot more desert than we bargained for. So much for naysayers of global warming. Global warming has been gradually making the world a hotter place for years, and during the process made our weather more violent. For years governments and polluting companies have been naysaying it, saying that global warming is just "hogwash" and "poppycock". But its here and we are feeling its effects. Smog alerts in cities, elderly people and even young people dying from heat stroke, crop failures due to lack of water, climate changes in parts of the United States and Canada where people used to have a harsh winter are now having a very mild winter, and where they used to have a warm summer, they are now having heat waves and drought. Outside my window, even as I type this, Toronto is being poured on by water, hail and lightning. Only 30 minutes ago we were having 95 degree Fahrenheit weather. I was utterly surprised when I looked out the window, wondering why I was hearing thunder. And then confirmation in the newspapers, on television: The hottest summer on record.
Now technically we haven't yet had the hottest day on record. In Toronto, on July 8th, 9th and 10th of 1936 the mercury hit 40.6 degrees celsius (106 Fahrenheit). It was the hottest three days in Toronto history. Over 200 people died from heat stroke during that heat wave, a heat wave which lasted a total of seven days. What makes this heat wave bigger is not the intensity of it, but the duration. Already we are on day 14 of the current heat wave (which has been marked only sporadically with thunder storms). The temperature has been consistently above 35C (95 Fahrenheit) every day. Compared to 2004, during the entire year there was only 13 days in which the temperature went over 35C. We are only at the end of June, and we've already had more "hot days" than the previous year. And Toronto is not known for being an exceptional hot city, as far as North America is concerned. It is essentially a normal Canadian city when it comes to temperature. All across Canada and the United States, and indeed the world, other cities have been having record temperatures and long heat waves that make the 1930s seem cool in comparison. But whats causing this global heat wave? Actually the answer is simple. During the 1990s 70% of all air pollution (which causes global warming and ozone layer depletion) came from cars, but these days that figure is closer to 75% or 80%. The reason why its higher is due to a combination of cars becoming more popular in China and India, more people driving, driving becoming more popular (especially during the summertime) and people driving gas guzzling SUVs. SUVs are actually classified as "trucks", which have dramatically lower emission standards. As a result, people aren't just paying more for the gasoline due to their gas guzzling SUV, they are also dramatically adding to the air pollution around them. According to scientists and meteorologists in the United States and Canada, July and August are going to be even hotter than June. This is because the air pollution and heat already present in the atmosphere will essentially stay and have a lasting effect. Scientists in the antartica who record the temperatures, how many ice bergs break off from the ice cap and estimate how much ice has melted during the year are starting to panic. Over half of the ice continent is currently having weather above the freezing mark, meaning that over half of the ice is melting at a record rate. The melting is causing cracks to form, and dropping huge icebergs weighing thousands of tonnes into the ocean.
While this effect does cool down the planet globally, by the ice absorbing extra heat, it also increases the holes in the ozone at the same time, creating a "runaway effect" by which it simply gets hotter and hotter and hotter. Moreover, the planet is also warmed by oceanic currents which bring warmer water into colder climates, thus warming up those regions. Too much ice can cause the currents to reverse direction, bringing colder water into areas that are normally quite hot. This is what happens every so often during El Nino, and thus creates "reverse weather", snow in the summer, warm in the winter, etc. Except El Nino is only a temporary change in the global climate. A complete reversal of the oceanic currents is what scientists sometimes call a "Seismic Climate Shift", and normally only happens once every 50,000 years, and is accompanied by a new ice age. But hopefully that won't happen anytime soon. The movie "The Day After Tomorrow" would have people believe that it really could happen any day, and that when it does, it could be very dramatic. The truth is that yes, it could start any day, but it certainly would not be as dramatic. Instead it would be more like a really long El Nino that gradually gets colder and colder until the ice caps reform. After which point, I must point out that an "Ice Age" really is not that cold. It is in polar areas, but around the equator the temperatures remain quite tropical. Such a dramatic climate shift would result in massive migration to warmer regions, food shortages, and wars. But hopefully that won't happen for a very long time, and hopefully it will be a gradual process. As it currently stands however, the world population is continuing to grow at a dramatic rate. There are currently 6.5 billion people and by the year 2100, if the population continues to grow at the same rate, there will be over 20 billion people. While western countries such as the United States and Canada currently enjoy an abundancy of food (and are two of the fattest countries in the world), by 2100 the population of Canada is expected to grow to 200 million from its current 31 million, and the United States population is expected to grow to 1.2 billion from its current 296 million. Five generations of children/immigration will literally see an explosion in population. So is 2005 the hottest year on record? Yes, yes it is. But with dramatically growing populations, increased usage of automobiles, there is definitely going to be hotter years than this one.
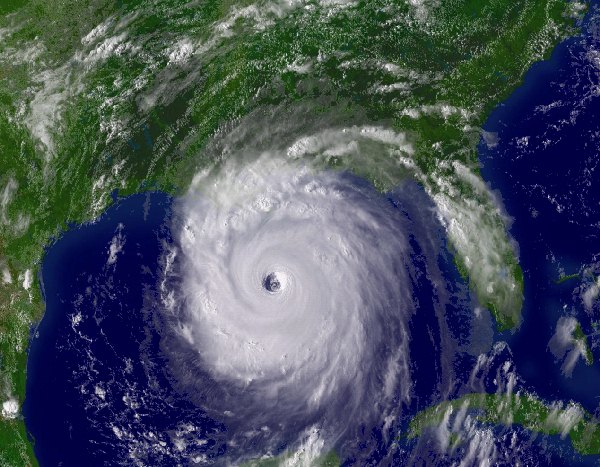
Summer Heat Wave and Hurricanes 2005There has been a great deal of talk this summer about intense heat (particularly the recent, brutal heat wave in the Southwest and the crushing drought in the Midwest) and incessant hurricane activity. Many have speculated that these weather events are effects of global warming. Although this summer's extreme weather is consistent with what is expected in a warming world, we cannot point to any individual heat wave, hurricane, drought, or inundation as a result of global warming. Below we compare this summer's early events to climate statistics over a longer time perspective. This summer's heat is consistent with a long-term warming trend and looks to be one of the hottest summers on record. In fact, June 2005 was the second warmest June on record (since 1880) according to the National Climate Data Center (NCDC). Furthermore, nine of the top 10 warmest years globally have occurred since 1995 and multiple studies show that the high average temperatures in the northern hemisphere over the last decade are unprecedented over the past 2,000 years. Current scientific evidence suggests a link between hurricane intensity and warming trends but not frequency. The scientific journal Nature just published new research by an MIT scientist, Dr. Kerry Emanuel, which tracked the potential destructiveness of tropical storms and found that it had doubled over the last 30 years. Dr. Emanuel defines the potential destructiveness as a function of both storm intensity and duration. The majority of the rise in potential destructiveness occurred during the past 10 years when global average surface temperatures were at record levels. Given these long-term trends, the events of June/July 2005 are clearly consistent with the predicted effects of global warming. However, weather and climate are different issues. Weather describes a short-term state of the atmosphere. It can change dramatically over a very short period of time as a result of natural variability. In contrast, climate describes the average weather conditions for a particular region over a long time period—typically 30 years. Therefore the recent weather events by themselves cannot be considered "evidence" of global warming. Rather they must be evaluated within the context of the longer-term patterns and natural weather variability.
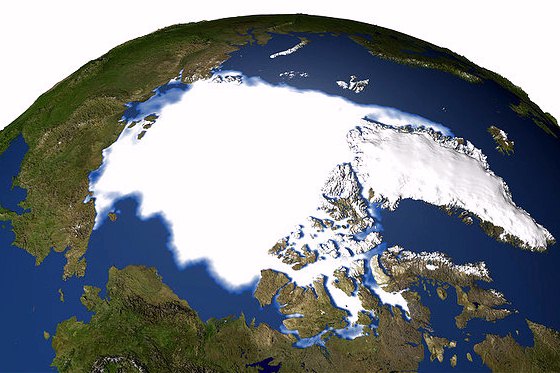
World Temperatures Keep Rising With a Hot 2005New international climate data show that 2005 is on track to be the hottest year on record, continuing a 25-year trend of rising global temperatures. Climatologists at NASA's Goddard Institute for Space Studies calculated the record-breaking global average temperature, which now surpasses 1998's record by a tenth of a degree Fahrenheit, from readings taken at 7,200 weather stations scattered around the world. The new analysis comes as government and independent scientists are reporting other dramatic signs of global warming, such as the record shrinkage of the Arctic sea ice cover and unprecedented high ocean temperatures in the Gulf of Mexico. Late last month, a team of University of Colorado and NASA scientists announced that the Arctic sea ice cap shrank this summer to 200 million square miles, 500,000 square miles less than its average area between 1979 and 2000. And a scientist at the National Oceanic and Atmospheric Administration determined that sea surface temperatures in the Gulf of Mexico were higher in August than at any time since 1890, which may have contributed to the intense hurricanes that struck the region this year. "At this point, people shouldn't be surprised this is happening," said Goddard atmospheric scientist David Rind, noting that 2002, 2003 and 2004 were among the warmest years on record. Many climatologists, along with policymakers in a number of countries, believe the rapid temperature rise over the past 50 years is heavily driven by the burning of fossil fuels and other human activities that have spewed carbon dioxide and other "greenhouse gases" into the atmosphere. A vocal minority of scientists say the warming climate is the result of a natural cycle. Rind compared the warming trend to what happens when a major league baseball team owner spends lavishly on players' salaries. Pumping heat-trapping gases into the atmosphere, he said, produces the same kind of predictable results as boosting a team's payroll. "When they get into the playoffs, should we be surprised?" he asked. "We're putting a lot more carbon dioxide into the atmosphere, and we're getting a lot higher temperatures." Global temperatures this year are about 1.36 degrees Fahrenheit (0.75 Celsius) above the average between 1950 and 1980, according to the Goddard analysis. Worldwide temperatures in 1998 were 1.28 degrees Fahrenheit (0.71 Celsius) above that 30-year average. The data show that Earth is warming more in the Northern Hemisphere, where the average 2005 temperature was two-tenths of a degree above the 1998 level. Climate experts say such seemingly small shifts are significant because they involve average readings based on measurements taken at thousands of sites. To put it in perspective, the planet's temperature rose by just 1 to 1.5 degrees Fahrenheit over the past century. Rind, who said it would probably take a major event such as a massive volcanic eruption to keep this year from setting a record, said that scientists expect worldwide temperatures to rise another degree Fahrenheit between 2000 and 2030, and an additional 2 to 4 degrees by 2100. From that perspective, this year's higher temperatures are "really small potatoes compared to what's to come," he said. But one skeptic, state climatologist George Taylor of Oregon, said it is difficult to determine an accurate global average temperature, especially since there are not enough stations recording ocean temperatures. "I just don't trust it," Taylor said of the new calculation, noting that Goddard's findings are "mighty preliminary." Several scientists said yesterday that Earth's rapid warming could become self-perpetuating as the buildup of heat in the air, on land and in the sea accelerates. Ted A. Scambos, the lead scientist at the National Snow and Ice Data Center in Boulder, Colo., said the shrinkage of sea ice in the Arctic makes it more likely that the region will warm faster, because open water absorbs much more heat from the sun than snow and ice. "Change is really happening in the Arctic. We're going to see this again and again," Scambos said. He added that, because the Arctic helps keep global temperatures down, any warming there can mean "you're going to change [the world's] climate significantly." In response to recent warming in the Arctic, a coalition of environmental groups said it plans to sue the Interior Department to force it to list polar bears as threatened under the Endangered Species Act because the sea ice they depend on is disappearing. The Natural Resources Defense Council, the Center for Biological Diversity and other groups petitioned for the listing in February, but they say Interior Secretary Gale A. Norton has yet to respond. "The polar bear's a harbinger of what's to come. It's the first animal to be threatened with extinction by climate change, but it won't be the last," said NRDC attorney Andrew Wexler. He noted that polar bears cannot adapt well to rising temperatures because they are dependent on sea ice for survival. U.S. Fish and Wildlife Service spokesman Chris Tollefson said the agency is analyzing the petition. "We haven't really reached a conclusion," Tollefson said. The Bush administration has consistently advocated funding for technological research rather than requiring curbs in carbon dioxide emissions, saying that such limits could damage the economy. William O'Keefe, chief executive of the George C. Marshall Institute, which is skeptical of global warming predictions, said policymakers should not rush to impose new rules on industry when it remains unclear whether the current warming worldwide reflects natural climate variability or a human-induced trend. "It still remains very complicated," O'Keefe said. But Rafe Pomerance, who served as deputy assistant secretary of state for the environment under President Bill Clinton and who now chairs the bipartisan Climate Policy Center, said a modest system to limit and trade carbon dioxide emissions could help curb global warming. "We need to develop a range of very serious policies and put them in place," Pomerance said.
The Cost of Global Warming in the Unites States
2005 Hurricane Wilma (October); preliminary estimate of over $ 10.0 billion in damage/costs; estimated 35 deaths. Hurricane Rita (September); preliminary estimate of over $ 10.0 billion in damage/costs; estimated 35 deaths. Hurricane Katrina (August); preliminary estimate of around $100 billion in damage/costs, making this the most expensive natural disaster in U.S. history; circa 1800 deaths - the highest U.S. total since the 1928 major hurricane in southern Florida. Hurricane Dennis (July); preliminary estimate of over $2 billion in damage/costs; at least 12 deaths. Midwest Drought (Spring-Summer); preliminary estimate of over $1.0 billion in damage/costs; no reported deaths. 2004 Hurricane Jeanne (September); preliminary estimate of over $6.9 billion in damage/costs; at least 28 deaths. Hurricane Ivan (September); NY. estimate of over $14 billion in damage/costs; at least 57 deaths. Hurricane Frances (September); estimate of approximately $9 billion in damage/costs; at least 48 deaths. Hurricane Charley (August); estimate of approximately $15 billion in damage/costs; at least 34 deaths. 2003 Southern California Wildfires (Oct.–Nov.); estimate of over $2.5 billion damage/costs; 22 deaths. Hurricane Isabel (Sept.); estimate of approximately $5 billion in damages/costs; at least 55 deaths. Severe Storms and Tornadoes (May); over $3.4 billion in damages/costs; 51 deaths. Storms and Hail (April.); over $ 1.6 billion in damages/costs: 3 deaths. 2002 Widespread Drought (Spring–Fall); estimate of over $ 10.0 billion in damages; no deaths. Western Fire Season (Spring–Fall); $ 2.0 billion in damages/costs; 21 deaths. 2001 Tropical Storm Allison (June); preliminary estimate of approximately $5.0 (5.1) billion; 43 deaths. Midwest and Ohio Tornadoes (June); $1.9 billion in damage/costs, at least 3 deaths. 2000 Drought/Heat Wave (Spring–Summer); preliminary estimate more than $4.0 (4.2) billion; estimated 140 deaths nationwide. Western Fire Season (Spring–Summer); more than $2.0 (2.1) billion; no deaths reported. 1999 Hurricane Floyd (Sept.); at least $6.0 (6.5) billion; 77 deaths. Eastern Drought/Heat Wave (Summer); more than $1.0 (1.1) billion; estimated 502 deaths. Oklahoma-Kansas Tornadoes (May); at least $1.6 (1.7) billion; 55 deaths. Arkansas-Tennessee Tornadoes (Jan.); approximately $1.3 (1.4) billion; 17 deaths. 1998 Texas Flooding (Oct.–Nov.); approximately $1.0 (1.1) billion; 31 deaths. Hurricane Georges (Sept.); estimated $5.9 (6.5) billion; 16 deaths. Hurricane Bonnie (Aug.); approximately $1.0 (1.1) billion; 3 deaths. Southern Drought/Heat Wave (Summer); $6.0-$9.0 billion; at least 200 deaths. Minnesota Severe Storms/Hail (May); more than $1.5 (1.7) billion; 1 death. Southeast Tornadoes and Flooding (Winter–Spring); more than $1.0 (1.1) billion; at least 132 deaths. Northeast Ice Storm (Jan.); more than $1.4 (1.5) billion; 16 deaths.
|
|
||||||||||||||||||||||||||||||
|
Website Design + SEO by designSEO.ca ~ Owned + Edited by Suzanne MacNevin | |||||||||||||||||||||||||||||||